Cash Game Preflop Charts — Poker Ranges for Cash Games
Explore poker cash game preflop charts with optimal ranges by position and stack size. Charts help you to build winning cash game strategies.
 Use the chart library
 Create your own charts


In cash games, your preflop strategy stays remarkably consistent. Stacks reset to 100BB after every hand, the blind structure doesn't change, and there's no ICM pressure forcing you to fold equity. That stability means a solid cash preflop chart can guide every hand you play at a given stake — for years.
But "solid" cash ranges aren't trivial. The right open from UTG is dramatically tighter than from the cutoff. Your 3-bet defense from the big blind changes based on the raiser's position. Multi-way pots versus blind-vs-blind heads-up play require different mental models. These charts make those distinctions explicit.
What's in this library
-
6-Max Cash GTO Charts by Jonathan Little — A complete 100BB baseline from one of the most prolific tournament and cash coaches in the world. Covers opens, 3-bet defense, 4-bet ranges, and blind-vs-blind play.
- Mid-Stakes 6-Max Charts by Kanu7 — Built by a long-time mid-stakes online regular. Sharper than baseline GTO in spots where the population deviates, with practical adjustments for typical pools.
- Overnight Monster Charts by AlvinTeachesPoker — Ranges from a NL10,000 regular sharpened for tougher games where opponents play closer to equilibrium.
How to use cash preflop charts
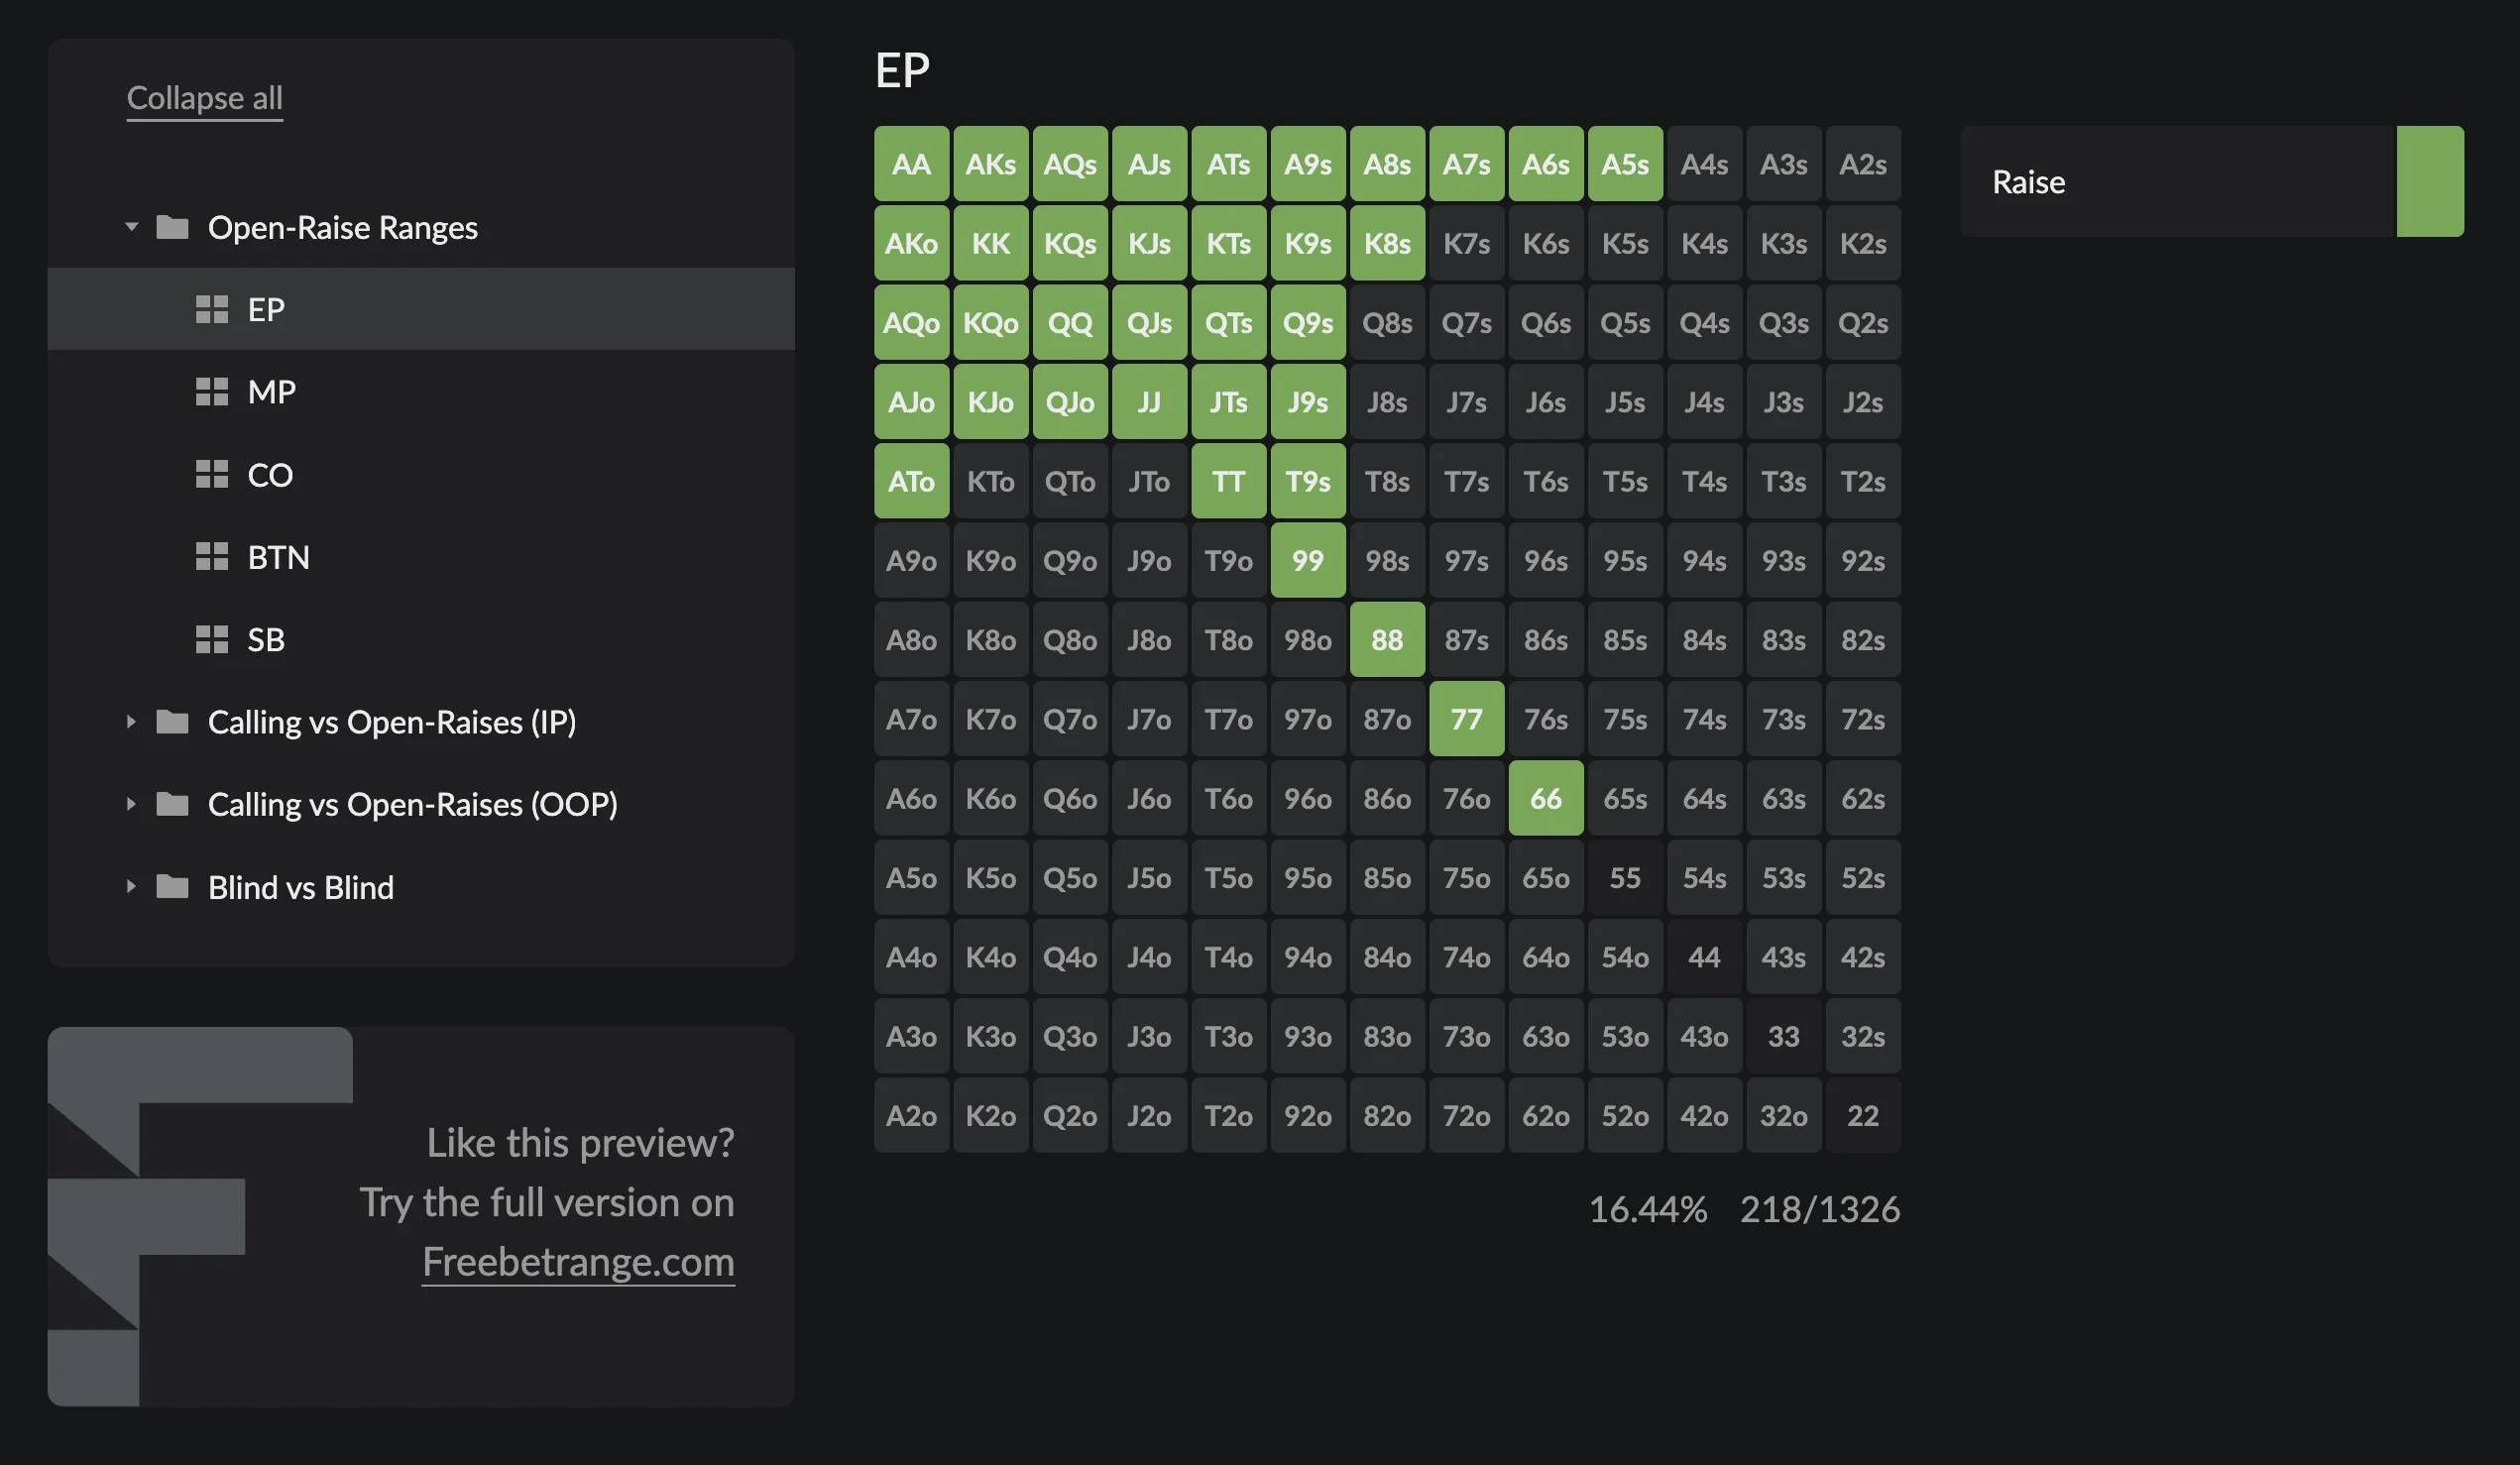
Start by memorizing your open-raising ranges by position. These come up the most often and are where weak players leak the most money. Once opens are solid, move to 3-bet defense and 3-bet ranges, then 4-bets, then blind-vs-blind spots.
Don't try to learn every chart at once. Pick one chart that matches your stake and pool, drill it for 1–2 weeks, then expand. Charts are baselines — use them with your HUD stats and reads to adjust against specific players.
If you want a deeper study path, The Preflop Game by LucidPoker walks through the theory behind these ranges and the situations where deviation is correct.
FAQ
What stack depth do these cash charts assume? All charts in this library are built for the standard 100BB effective stack — the default in online cash games. For deeper play (150BB+) some opens widen marginally; for shallow stacks (40BB) ranges tighten and 3-bet structure changes. If you regularly play non-standard stack sizes, build a custom chart with our free chart builder.
Are these 6-max or full ring charts? The current cash library focuses on 6-max, which is the dominant online format. Full-ring (9-max) ranges from UTG through MP are tighter than 6-max equivalents — a useful adjustment if you transition.
Should I open the same range online and live? Generally yes, with one caveat: live pools tend to be looser and more passive, so you can open slightly wider in late position and 3-bet linear value-heavy ranges more often. The charts here give you the equilibrium baseline; live adjustments come from reads.
How do I adjust these charts against tight or loose opponents? Against tight players who fold too much, widen your open-raising range by 5–10% in late position and 3-bet more bluffs. Against loose players who call too much, tighten your range slightly and 3-bet polarized (value-heavy with select bluffs). The chart is the starting point; exploitation is the edge.
Where can I apply these ranges? Anywhere you play 6-max cash. The math is the same online and live, micro stakes through mid stakes. As you move up, opponents will start respecting your ranges more, and you'll need to layer in more balanced bluffs and mixed strategies.